

What a 20, 15 and 10 Handicap Golfers Index Actually Looks Like
If you ask a room full of 20, 15 and 10 Handicap golfers how far they hit their driver or how many three-putts they have in a round, you will get a masterclass in creative storytelling.
Golfers are built on outcome bias. We remember the one 285-yard drive that hit a cart path and caught a favorable bounce down a hill, but completely erase the three pushed drives into the native area that preceded it. We remember the 25-foot birdie putt we drained on the 9th, but forget the three 3-footers we yanked for bogey on the back nine.
This gap between perception and reality is the single biggest barrier to lower scores.
When you build your course strategy, target selection, and practice routine around your best shots rather than your average performance, you force yourself into high-risk situations you don’t have the skill to execute.
To break through performance plateaus—whether you’re stuck at 92, trying to break 85, or pushing for the 70s—you have to look at unemotional, objective data. Thanks to millions of tracked shots from systems like Shot Scope and Arccos, alongside insights from data analysts like Lou Stagner, we no longer have to guess what separates a 20-handicap from a 10-handicap.
Here is the deep, unfiltered breakdown of what 20, 15, and 10 handicaps actually do on the golf course, where the strokes are lost, and how each group can systematically reach the next level.
+-----------------------------------------------------------------------------------------+
|                                REAL-WORLD BENCHMARK SUMMARY                             |
+------------------------------------+------------------+------------------+--------------+
| METRIC                             | 20 HANDICAP      | 15 HANDICAP      | 10 HANDICAP  |
+------------------------------------+------------------+------------------+--------------+
| Scoring Average                    | ~94.5            | ~88.5            | ~83.0        |
| True P-Avg Driver Distance         | 208 Yards        | 218 Yards        | 228 Yards    |
| Fairways in Play (or clean lie)    | 42%              | 47%              | 52%          |
| Greens in Regulation (GIR)         | 3.2 (18%)        | 5.1 (28%)        | 7.2 (40%)    |
| Penalty Shots / Trouble Lies       | 3.8 per round    | 2.4 per round    | 1.3 per round|
| Three-Putt Avoidance               | 3.2 per round    | 2.1 per round    | 1.2 per round|
| Up-and-Down % (Within 30 yards)    | 18%              | 26%              | 36%          |
+------------------------------------+------------------+------------------+--------------+
1. The 20-Handicap Profile: The Search for Consistency
- Typical Score Range: 91 – 98
- Core Mental State: Frustrated. Capable of hitting great individual shots, but constantly plagued by disaster holes (double bogeys and triples).
- Primary Cause of Lost Strokes: Penalty shots off the tee and compounded mistakes around the greens.
+-------------------------------------------------------------------------+
|                       20-HANDICAP STROKE LEAKAGE                        |
|                                                                         |
|  [ Off-the-Tee Penalties / Lost Balls ]  =========> 3.8 Strokes Lost    |
|  [ Three-Putts ]                         =========> 3.2 Strokes Lost    |
|  [ Failed Chipping / Pitching ]          =========> 3.5 Strokes Lost    |
|  [ Poor Approach Decisions / Fat Shots ] =========> 4.0 Strokes Lost    |
+-------------------------------------------------------------------------+
The Tee Box Reality
The average 20-handicap golfer believes their main issue off the tee is a lack of distance. On golf forums and social media, the claim is almost always, “I hit it about 250, but my direction is off.”
The real-world data paints a completely different picture.
The true average driver distance (excluding absolute mis-hits, but accounting for normal roll out) for a 20-handicap is 208 yards. More importantly, the dispersion cone off the tee is vast. A 20-handicap misses the fairway by an average of 35 to 45 yards left or right on off-center hits.
This wide dispersion results in 3.8 penalty or forced recovery strokes per round. That is nearly four full strokes lost simply because the ball landed in hazard stakes, out of bounds, or buried deep in dense trees where advancing the ball forward requires a sideways punch-out.
Approach Play & Greens in Regulation
A 20-handicap hits an average of 3.2 Greens in Regulation (GIR) per round (roughly 18%).
When a 20-handicap misses a green, it is rarely by a small margin. They tend to miss short because they club themselves based on their absolute best strike. If their 7-iron goes 150 yards once out of ten swings, they pull 7-iron from 150 yards every single time.
Because their average strike is off-center, the ball lands 12 to 15 yards short of the green, leaving difficult pitch shots over bunkers or through thick rough.
Short Game & Putting
Around the green, the 20-handicap converts an up-and-down only 18% of the time from within 30 yards.
The main issue here is not a lack of hand-eye coordination; it is choice of loft and contact. 20-handicaps frequently reach for a 60-degree lob wedge for basic chips, leading to bladed shots over the green or thudded fat shots that move 4 feet.
On the greens, a 20-handicap averages 3.2 three-putts per round. Their distance control on long lag putts (30+ feet) leaves them with an average second putt distance of over 6 feet—a distance from which mid-to-high handicappers only make about 40% of their putts.
How a 20-Handicap Reaches a 15-Handicap
If you are a 20-handicap, your path to dropping 5 strokes is not found in an intricate swing rebuild. It is found in disaster mitigation.
- Play for the Center of the Green: Stop aiming at flags. Select a club based on your average hit to reach the back-center of the green. This automatically eliminates the short miss into front-guarding hazards.
- Ditch the High-Loft Wedges: Put the 60-degree wedge in the closet. Use a 50-degree gap wedge or 56-degree sand wedge for basic chips, keeping the ball low and rolling like a putt as quickly as possible.
- Keep the Driver in Bounds: Trade 15 yards of potential distance for finding a playable lie. If a shorter driver shaft (or a 3-wood off the tee) keeps you out of the trees, you instantly save 3 to 4 strokes a round.
2. The 15-Handicap Profile: The Plateau of Mediocrity
- Typical Score Range: 85 – 91
- Core Mental State: Encouraged yet blocked. Frequently posts solid 42s on one 9-hole stretch, followed by an agonizing 47 on the other.
- Primary Cause of Lost Strokes: Lack of proximity on approach shots and steady, minor leakages on lag putting.
+-------------------------------------------------------------------------+
|                       15-HANDICAP STROKE LEAKAGE                        |
|                                                                         |
|  [ Off-the-Tee Penalties / Lost Balls ]  =====> 2.4 Strokes Lost        |
|  [ Three-Putts ]                         =====> 2.1 Strokes Lost        |
|  [ Failed Chipping / Pitching ]          =====> 2.2 Strokes Lost        |
|  [ Poor Approach Decisions / Fat Shots ] =====> 3.0 Strokes Lost        |
+-------------------------------------------------------------------------+
The Tee Box Reality
The 15-handicap has generally eliminated the wild, terrifying shank-slice off every tee box, but they still struggle with a reliable two-way miss. Their true average driver distance moves up to 218 yards.
They find the fairway (or the clean first cut) roughly 47% of the time. While they lose far fewer balls out-of-bounds than a 20-handicap, they still manage 2.4 penalty shots or punch-outs per round.
The main issue for the 15-handicap isn’t blowing up on every hole—it’s that their misses still land in places that eliminate any chance of hitting the green on shot two.
Approach Play & Greens in Regulation
The 15-handicap averages 5.1 Greens in Regulation per round (roughly 28%).
This is the area where the 15-handicap plateau becomes most obvious. While they hit almost two more greens per round than a 20-handicap, their average proximity to the hole on missed greens is still wide.
15-HANDICAP APPROACH PROXIMITY (125 - 150 YARDS)
+-------------------------------------------------------------------------+
| Target: Flagstick                                                       |
| Actual Landing Zone: 42 feet average proximity                          |
| Common Miss: Short-sided in green-side rough                            |
+-------------------------------------------------------------------------+
Because 15-handicaps aim directly at flags tucked near greenside bunkers or hazards, their bad shots result in “short-sided” misses. A short-sided lie leaves them minimal green to work with, forcing a delicate chip shot that they do not possess the skill to pull off consistently.
Short Game & Putting
The 15-handicap gets up-and-down 26% of the time from within 30 yards.
They are far better at making solid contact than the 20-handicap, but their target selection around the green remains poor. They often try to chip it dead to the pin rather than picking a broad landing zone 3 feet onto the green and letting the ball roll out naturally.
On the greens, 15-handicaps average 2.1 three-putts per round. This is where subtle strokes leak away. A 15-handicap rarely four-putts, but they routinely leave 30-footers 5 to 6 feet short, placing constant pressure on their mid-range par-saving putts.
How a 15-Handicap Reaches a 10-Handicap
To break out of the mid-80s and head toward the high-70s, the 15-handicap must shift from swing-focused thinking to analytical thinking.
- Adopt “Aim Small, Miss Small” Course Management: Stop chasing tucked pins. Calculate the middle of the green, look at where the hazard is, and aim toward the safest half of the putting surface. Turning short-sided misses into basic 25-foot putts eliminates bogey-trains instantly.
- Master Lag Putting Speed: Spend 80% of your putting practice on distance control from 30, 40, and 50 feet. Your goal is simple: ensure your first putt always settles within a 3-foot radius of the hole.
- Tighten Your Driver Setup: Consider shortening your driver shaft by 0.5 inches to bump your center-face contact rate. Moving your fairways-in-play percentage from 47% to 52% gives you two more realistic approach shots per round.
3. The 10-Handicap Profile: The Efficiency Model
- Typical Score Range: 80 – 85
- Core Mental State: Focused and competitive. Capable of breaking 80 when the putting surface cooperates, but occasionally held back by minor tactical errors.
- Primary Cause of Lost Strokes: Inability to convert scrambles into pars and subtle proximity limitations from 120+ yards.
+-------------------------------------------------------------------------+
|                       10-HANDICAP STROKE LEAKAGE                        |
|                                                                         |
|  [ Off-the-Tee Penalties / Lost Balls ]  ==> 1.3 Strokes Lost           |
|  [ Three-Putts ]                         ==> 1.2 Strokes Lost           |
|  [ Failed Chipping / Pitching ]          ===> 1.5 Strokes Lost          |
|  [ Poor Approach Decisions / Fat Shots ] ====> 2.0 Strokes Lost          |
+-------------------------------------------------------------------------+
The Tee Box Reality
A real 10-handicap is a highly effective off-the-tee player compared to the broader golfing public. Their true P-Avg driver distance sits at 228 yards, and they keep the ball in playable territory (fairway or clean first cut) 52% of the time.
Crucially, their off-the-tee penalty rate drops to 1.3 per round.
The 10-handicap rarely hits absolute disaster drives. Their misses are manageable—sitting in the light rough or on a wide angle that still allows them to advance the ball toward the green. They understand their default shot shape (e.g., a predictable 10-yard fade) and play for it on every tee box.
Approach Play & Greens in Regulation
The 10-handicap hits an average of 7.2 Greens in Regulation per round (40%).
This is the single biggest statistical separator between a 15-handicap and a 10-handicap. Hitting 7+ greens per round guarantees 7 stress-free two-putt par opportunities.
10-HANDICAP APPROACH PROXIMITY (125 - 150 YARDS)
+-------------------------------------------------------------------------+
| Target: Center of Green / Safe Side                                     |
| Actual Landing Zone: 31 feet average proximity                          |
| Common Miss: On the green, long/safe side                               |
+-------------------------------------------------------------------------+
The 10-handicap manages approach shots far better than lower-tier handicaps. When they miss a green, they miss in the designated “safe zone”—leaving an easy uphill chip rather than a complex bunker shot over a high lip.
Short Game & Putting
Around the green, the 10-handicap converts an up-and-down 36% of the time from within 30 yards.
When they miss a green, they almost always get their chip or pitch shot onto the putting surface on the first attempt, leaving themselves a makeable 6-to-10-foot putt for par. They rarely waste strokes through double-chipping or chunking into green-side hazards.
On the greens, the 10-handicap is clean: 1.2 three-putts per round. Their speed control on lag putts is solid, and their short-putt conversion rate inside 4 feet sits above 85%.
How a 10-Handicap Breaks 80 (Heading to Single Digits)
For a 10-handicap, breaking into single digits (and consistently shooting 76–79) requires refining small edges.
- Optimize Short-Game Scrambling: Move your up-and-down percentage from 36% closer to 45-50% by mastering two basic trajectory chips: a low runner and a mid-height soft lander.
- Dial In Scoring Clubs (80 to 120 Yards): A 10-handicap cannot afford to miss greens when holding a wedge or short iron. Focus practice on distance-matrix control with your gap and pitching wedges.
- Use Strokes Gained Analytics: Track your rounds with a system like Shot Scope or Arccos to identify your precise leak. If your data shows you lose strokes on approach shots from 150+ yards, you know exactly where to allocate your practice time.
4. Head-to-Head Comparison: The Anatomy of a Single Hole
To see how these statistical differences play out in real-time, consider how a 20, 15, and 10 handicap play a standard 400-yard Par 4 with a water hazard along the right side of the fairway and a front-left green-side bunker.
+-----------------------------------------------------------------------------------------+
|                              PAR 4 HOLE REALITY COMPARISON                              |
+----------------------------------+-------------------+-------------------+--------------+
| PLAY PHASE                       | 20 HANDICAP       | 15 HANDICAP       | 10 HANDICAP  |
+----------------------------------+-------------------+-------------------+--------------+
| Tee Shot Selection               | Driver (Max Effort)| Driver (Normal)  | Driver (Controlled)|
| Tee Shot Result                  | 205 yds into rough| 220 yds in fairway| 230 yds in fairway|
| Remaining Distance               | 195 Yards         | 180 Yards         | 170 Yards    |
| Approach Club Chosen             | 4-Hybrid (best hit)| 5-Iron (best hit) | 6-Iron (average)|
| Approach Shot Result             | Short, in bunker  | Short-sided rough | Green (28 ft)|
| Third Shot                       | Bunker shot to 18'| Chip to 8 feet    | Lag putt to 2'|
| Fourth Shot                      | Putt to 4 feet    | Missed par putt   | Tap-in par   |
| Fifth Shot                       | Sunk bogey putt   | Tap-in bogey      | --           |
| FINAL HOLE SCORE                 | 5 (Bogey) or 6    | 5 (Bogey)         | 4 (Par)      |
+----------------------------------+-------------------+-------------------+--------------+
The Takeaway from the Comparison
- The 20-handicap makes the hole difficult on shot one by missing into a bad lie, and compounds the error on shot two by pulling a club that requires a perfect strike to reach the green.
- The 15-handicap plays a solid tee shot, but makes a minor strategic error on shot two by targeting a pin close to the rough, leaving a tough up-and-down.
- The 10-handicap plays a controlled tee shot, pulls a club based on their true average distance, aims for the wide part of the green, and rolls two comfortable putts for a stress-free par.
5. The Golden Rules of Lowering Your Handicap
No matter where your index sits today, the path down the handicap ladder follows three rules proven by data:
+-------------------------------------------------------------------------+
|                       THE 3 GOLDEN DATA RULES                           |
|                                                                         |
|  1. ELIMINATE PENALTIES  --> Going from 3.8 to 1.3 penalties saves 2.5  |
|                              strokes instantly without a swing change.  |
|                                                                         |
|  2. AIM FOR THE CENTER   --> Hitting 3 more greens per round cuts your   |
|                              scrambling load by 33%.                    |
|                                                                         |
|  3. LAG PUTT TO 3 FEET   --> Eliminating 2 three-putts per round drops  |
|                              your average score by 2 full strokes.      |
+-------------------------------------------------------------------------+
Rule 1: Eliminate Penalty Shots
Going from a 20-handicap to a 10-handicap saves 2.5 strokes per round purely on penalty avoidance. That has nothing to do with your golf swing mechanics—it is entirely about club selection off the tee and playing within your actual shot dispersion.
Rule 2: Prioritize Center-Face Contact Over Speed
Distance is a byproduct of center-face contact. Swinging at 95% effort and striking the heel or toe yields less ball speed and wider dispersion than swinging at 85% effort and finding the dead-center of the clubface.
Rule 3: Treat Golf as a Game of Proximity, Not Perfection
Stop judging your performance on whether a shot looked like a PGA Tour highlight. Golf is a game of managing bad shots. If your bad shots land on the edge of the green or in the first cut of rough, you will consistently post scores in the 70s and low 80s.
Here is a dedicated, conversion-focused section designed to fit naturally near the end of the post—right after the 10-handicap breakdown or in the “Putting It All Together” section.
It introduces the why and how of stat tracking, directly comparing Shot Scope and Arccos so readers can choose the system that fits their preferences (and budget), while providing high-converting affiliate insertion points.
6. How to Track Your Stats: Shot Scope vs. Arccos
You cannot fix what you do not measure. Guessing that you lost a round because of “poor driving” or “bad chipping” is how mid-handicappers spend years working on the wrong parts of their game.
To lower your handicap efficiently, you need Strokes Gained data. Strokes Gained compares every shot you hit against a database of thousands of rounds, telling you precisely where you are gaining or leaking shots relative to a target handicap.
Today, two platforms dominate the amateur stat-tracking space. Here is how they stack up so you can pick the right engine for your game:
+-----------------------------------------------------------------------------------------+
|                              STAT TRACKING PLATFORM COMPARISON                          |
+----------------------------------+---------------------------+--------------------------+
| FEATURE                          | SHOT SCOPE                | ARCCOS GOLF              |
+----------------------------------+---------------------------+--------------------------+
| Annual Subscription Fee          | $0 / FREE                 | ~$150 / Year             |
| Club Tracking Method             | RFID Tags + Watch/Connex  | Smart Sensors + App/Link |
| Phone in Pocket Required?        | No (with watch models)    | Optional (requires Link) |
| On-Course AI Caddie              | Basic                     | Advanced                 |
| Best For                         | Maximum value & no fees   | Tour-level AI insights   |
+----------------------------------+---------------------------+--------------------------+
Option 1: Shot Scope (Best Value & Zero Subscription Fees)
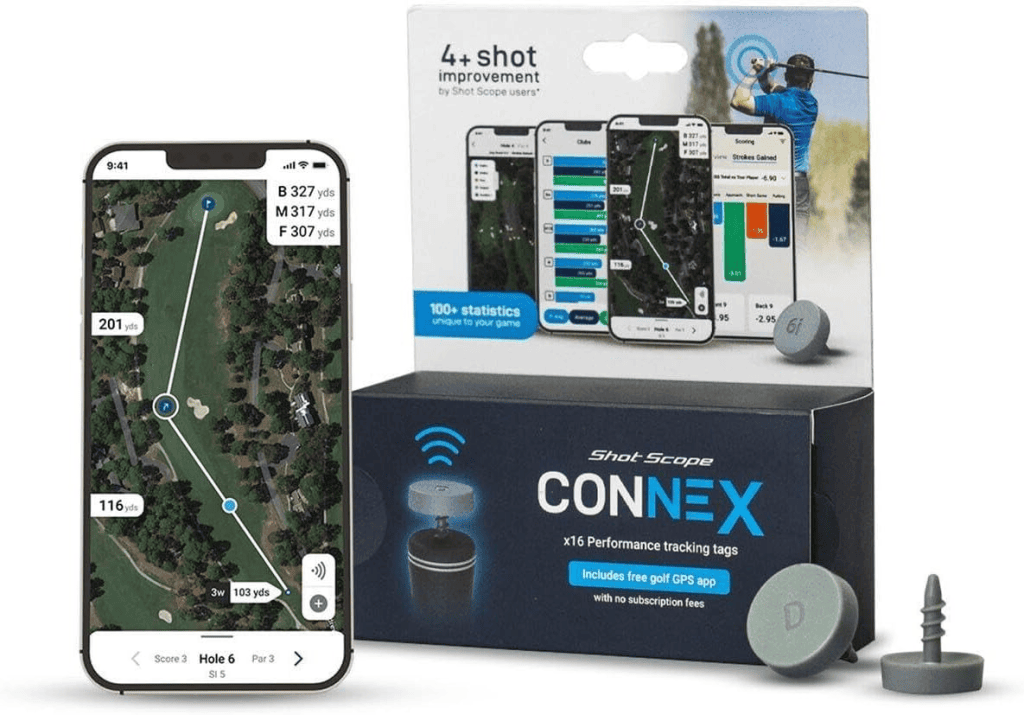
If you hate monthly or annual subscriptions, Shot Scope is the undisputed king of amateur stat tracking. You buy the hardware once, and you get lifetime access to their entire desktop and mobile analytics platform for free.
Shot Scope offers two primary setups depending on how you like to play:
- The Standalone Watch Experience: The Shot Scope X5 Smart Watch comes packed with lightweight RFID tags that screw into the top of your grips. As you pull a club, the watch automatically registers which club you’re using. It gives you real-time front/middle/back GPS distances on your wrist and uploads your complete Strokes Gained breakdown after the round without ever needing your phone on the course.
- The Budget-Friendly Mobile Setup: If you prefer using your smartphone, the Shot Scope CONNEX GPS Tags screw into your grips and tap directly to your phone before each shot. It’s the lowest-cost entry point into serious performance tracking on the market.
Bottom Line: Shot Scope is perfect for golfers who want clean, accurate Strokes Gained data, zero recurring costs, and a simple setup.
Option 2: Arccos Golf (Best for Deep AI Insights & Caddie Features)

Arccos is the official stat-tracking partner of the PGA Tour and Cobra/PING, featuring the most sophisticated AI modeling in amateur golf.
The system uses Arccos Smart Sensors paired with their powerful mobile app. Arccos continuously learns your exact club distances, accounts for real-time wind, elevation, and temperature, and gives you live “Smart Caddie” recommendations on every hole.
- The Seamless Experience: Arccos sensors automatically detect the impact of every shot.
- Phone-Free Play: If you don’t like playing with a smartphone in your front pocket, you can pair the sensors with the lightweight Arccos Link Clip, which clips onto your belt and records all shot data independently.
Bottom Line: Arccos carries an annual membership fee after your initial trial, but if you want the deepest AI-driven insights, automatic shot detection, and terrain-adjusted play-like distances, it is the most advanced system available.
How to Start Tracking Next Weekend
You don’t need to change your swing to start seeing results from data tracking. Pick the system that aligns with your tech setup and budget:
- Equip your set with smart sensors or RFID tags.
- Play 5 rounds without worrying about changing your strategy—just log your normal game to build an accurate baseline.
- Open your Strokes Gained dashboard and look at your primary leak. If the data shows you’re losing 3.0 strokes on approach shots from 120–150 yards, stop spending your practice sessions hitting drivers into the open range. Spend your time where the strokes are actually disappearing.
RELATED READ: Struggling with mental expectations when you miss a green short-sided? Read How Jon Sherman Changed My Expectations to see how redefining “successful shots” transforms your strategy.